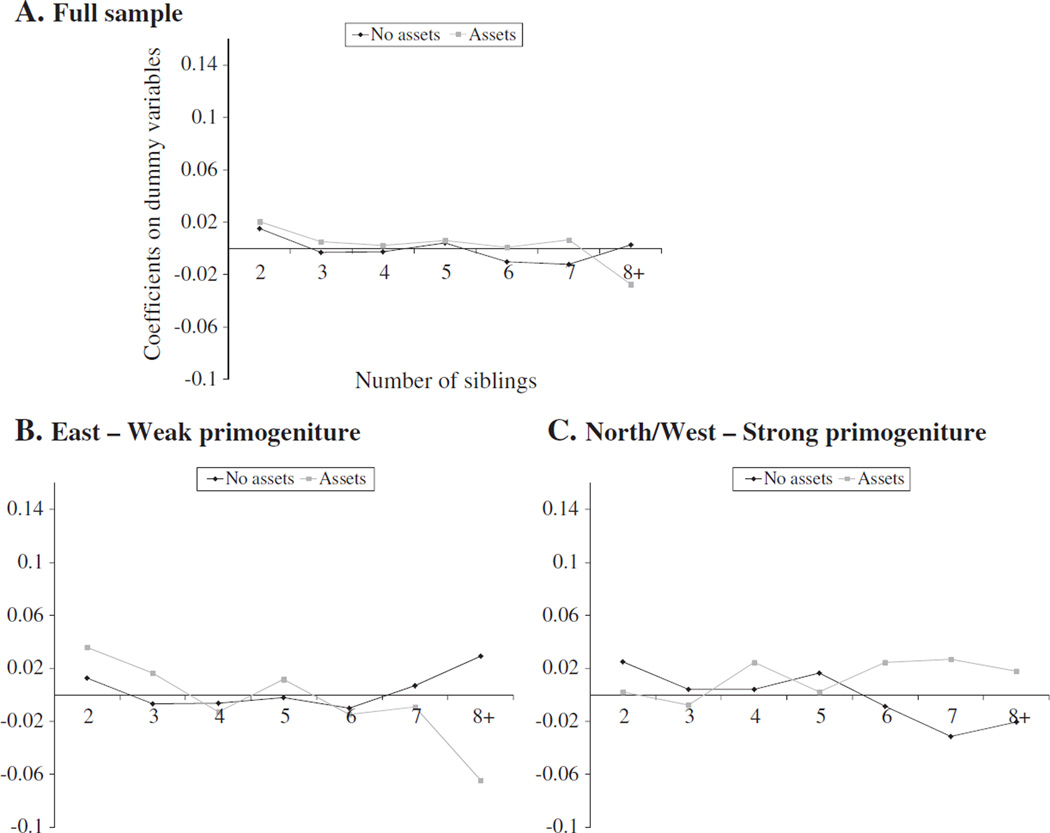
Fig. 1.
Coefficients on number of siblings from probit regression with dependent variable equal to ‘any migration’. Notes: Graphs report coefficients from the regressions in panel A of Table 3. The ‘no assets’ lines report coefficients on a vector of dummy variables for number of siblings. The ‘assets’ lines report the sum of coefficients on the main effect of number of siblings and interactions between number of siblings and household assets. The omitted category is households with only one child. Dots are enlarged if either the main effect is significantly different from zero (‘no assets’) or the interaction is significantly different from the main effect (‘assets’).

