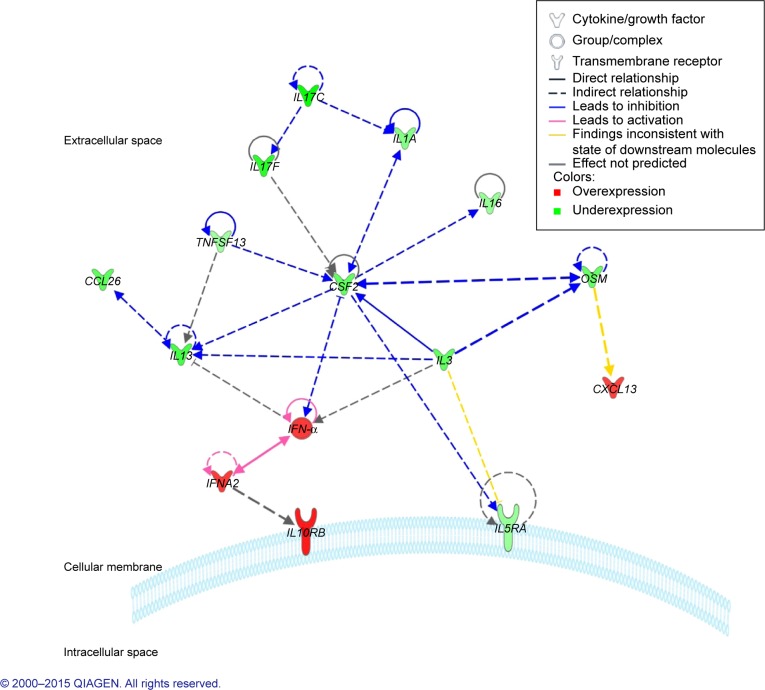
Figure 1.
IPA prediction of the interactive network between the differentially expressed genes in the blood of triple negative compared to ER/PR+ breast cancer patients.
Notes: Red – genes overexpressed; Green – genes underexpressed. Data were analyzed through the use of QIAGEN’s Ingenuity® Pathway Analysis (IPA®, QIAGEN Redwood City, www.qiagen.com/ingenuity).
Abbreviations: IPA, Ingenuity Pathway Analysis; ER, estrogen; PR, progesterone.

