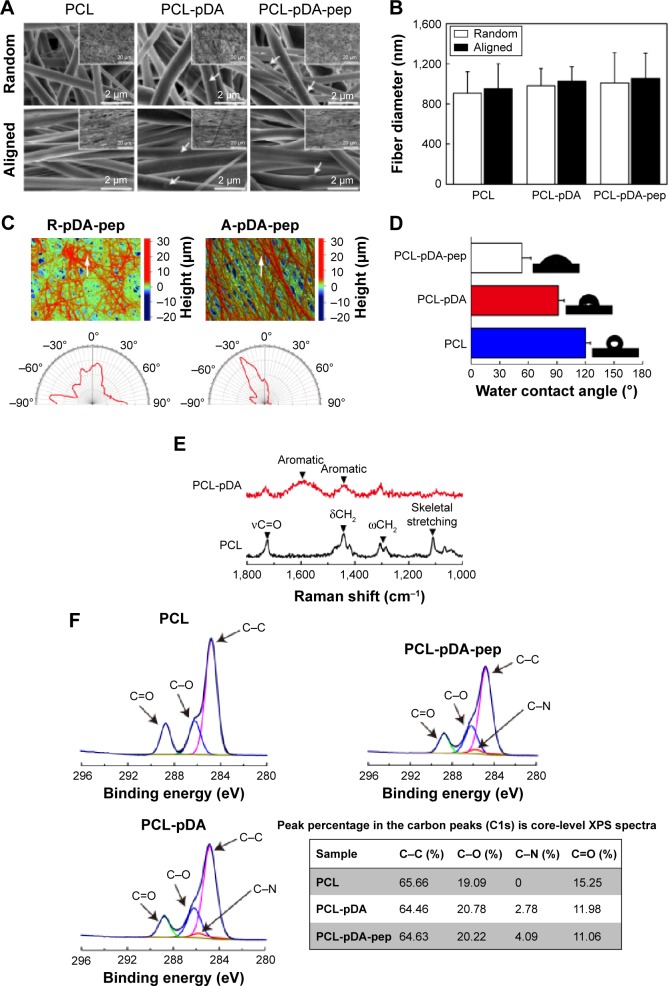
Figure 2.
Surface characterization of functionalized nanofibers.
Notes: (A) SEM images of peptide-decorated nanofibers. The white arrows represent the pDA aggregate particulates. The corresponding SEM images obtained at low magnification are shown as insets. (B) Fiber diameter measurement of nanofibers. (C) Representative surface topographical images of peptide-decorated nanofibers. The white arrows indicate the reference direction for orientation evaluation. The compass images represent the orientation distribution of peptide-decorated nanofibers with random and aligned orientation. (D) Water contact angle and representative images of water droplet on PCL nanofibers with different surface chemistries. (E) Raman spectra analysis of PCL and pDA-coated nanofibers. (F) High-resolution carbon peaks (C1s) from PCL nanofibers with different surface chemistries. The table shows the peak percentage in the carbon peaks (C1s) core-level XPS in different nanofibers.
Abbreviations: SEM, scanning electron microscope; pDA, polydopamine; PCL, polycaprolactone; XPS, X-ray photoelectron spectroscopy; R, pure randomly oriented PCL nanofiber; A, pure aligned PCL nanofiber; pep, peptide.

