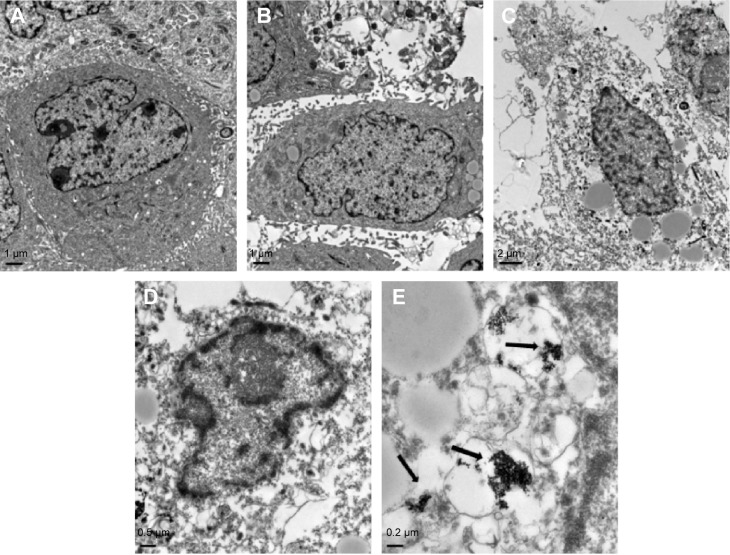
Figure 6.
Ultrastructure of SMMC-7721 cells (observed by TEM).
Notes: Sections from the blank control group (A); gene transfection-alone group (B); thermotherapy-alone group (C); and combined therapy group (D and E) are shown. TEM examination revealed that the necrotic areas in C and D were much larger than the intrinsic necrosis of the tumor shown in A and B. The black arrows indicate the magnetic nanoparticles. Magnification: A–C ×6,000; D ×12,000; E ×30,000.
Abbreviation: TEM, transmission electron microscopy.

