Fig. 3.
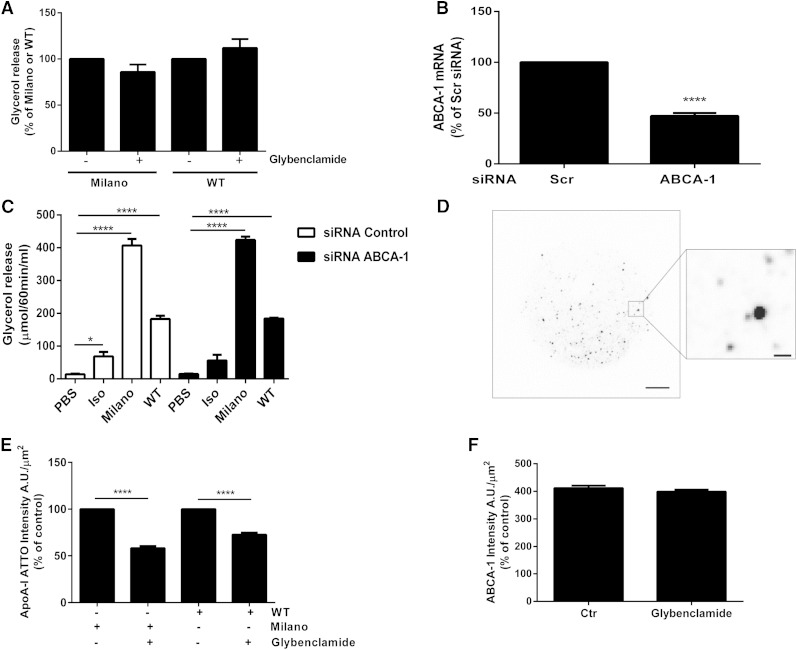
ApoA-I WT and Milano stimulate glycerol release independently of ABCA1. Rat adipose cells were preincubated with glybenclamide (250 µM) for 30 min, followed by Milano or WT stimulation (150 µg/ml) for an additional 30 min. Lipolysis was determined by measuring glycerol release in the medium. Data are presented as % of Milano or WT, n = 4 independent experiments (A). The expression of ABCA1 was silenced by electroporation of scrambled (scr) or ABCA1 siRNA into differentiated 3T3-L1 cells. ABCA1 expression were determined by real-time PCR analysis (ABCA1 mRNA % of scr), n = 12 (B). Glycerol release was measured in medium from 3T3-L1 cells electroporated with either scr or ABCA1 siRNA, or left untreated (PBS). Data presented as µmol/60 min/ml, n = 3 independent experiments, each condition run in duplicate in each experiment (C). Cells were incubated with fluorescently conjugated Milano-ATTO-565 or WT-ATTO-565 for 30 min (total concentration 150 µg/ml), before fixation and labeling as described in Methods. The distribution of ABCA1 labeling, Milano-ATTO-565, and WT-ATTO-565 was analyzed by TIRF microscopy. A representative image of the ATTO-565 signal captured in the TIRF zone, scale bar = 10 µm, insert scale bar = 1 µm (D). Rat adipose cells were preincubated with glybenclamide (250 µM), before incubation with Milano-ATTO-565 (30 min). Cells were fixed and labeled with ABCA1 antibodies, and the ATTO-565 and ABCA1 signal was detected in separate channels by TIRF microscopy. The graphs in E and F represent quantification of the fluorescence intensity/area unit (A.U./μm2) of ATTO-565 and ABCA1 labeling detected in the TIRF zone. n = 3–4 independent experiments, image analysis of 30 cells/condition/experiment. Data in A–C, E, and F are presented as mean ± SEM. * P ≤ 0.05, **** P ≤ 0.0001.

