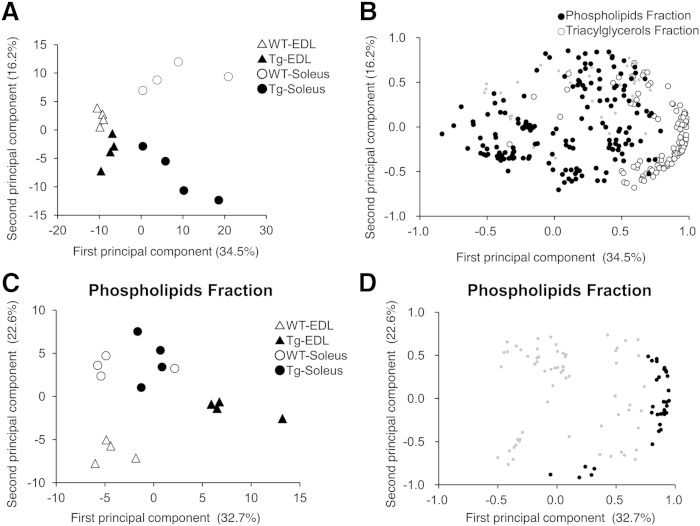
Fig. 1.
Changes in lipid profiles of the skeletal muscles overexpressing PGC-1α. A: Score plot of PCA for all detected peaks in lipid extracts from the skeletal muscles (EDL and soleus) of WT and PGC-1α-Tg (Tg) mice. B: Loading plot of PCA for all detected peaks in skeletal muscles (EDL and soleus) from WT and Tg mice. The peaks having chromatographic retention times between 14 and 29 min (phospholipid fraction) are highlighted in black closed circles and the peaks having retention times between 30 and 41 min (TG fraction) are highlighted in open circles. C: Score plot of PCA for lipid species in the phospholipid fraction of the skeletal muscles (EDL and soleus) from WT and Tg mice. D: Loading plot of PCA for lipid species in the phospholipid fraction of the skeletal muscles (EDL and soleus) from WT and Tg mice. Statistically significant species tested for factor loading (P < 0.000515) are highlighted in black closed circles.

