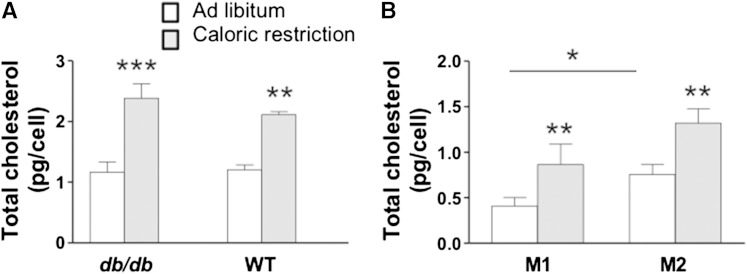
Fig. 1.
Total cholesterol levels in ATMs taken from obese mice. Epididymal adipose tissue was collected from mice fed ad libitum (open bar) or subjected to caloric restriction (gray bar) (A). The db/db mice were fed rodent chow and treated as described previously (17). WT mice were fed the HFD and their treatment is described in Materials and Methods. ATMs from db/db mice were further categorized based on their surface expression of CD11C and CD206 to assess the subpopulation of M1 (CD11C+CD206−) and M2 (CD11C−CD206+) and isolated by FACS (B). Total cholesterol levels were quantified using LC/MS/MS. Data are presented as mean ± SEM. * P < 0.02; **P < 0.001; ***P < 0.0004 for n = 10–11 mice per strain and n = 6 ATM samples.

