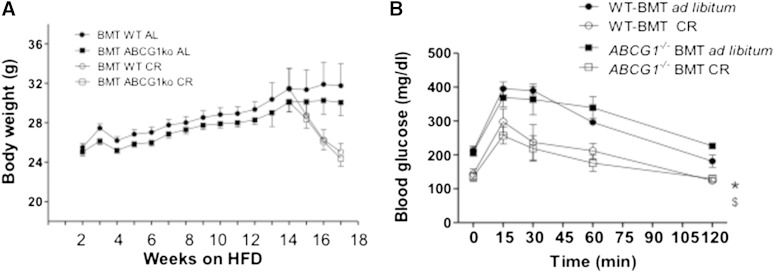
Fig. 7.
Body weights and glucose status for mice that are WT or deficient in Abcg1 expression. Animals were fed an HFD for 13 weeks and then subjected to 3 weeks of caloric restriction (CR) or maintained ad libitum on the HFD. Mouse groups are as described in Figure 2. Mice were monitored for body weight weekly. (A) No significant differences were seen between WT-BMT and Abcg1−/− BMT mice during either the ad libitum or CR arms of this study. Data are presented as means ± SEM; n = 39–40 for weeks 1–12; n = 9–10 for weeks 13–16. IPGTTs were performed at several time points as described in Materials and Methods. (B) Shown are final values for BMT mice including WT mice transplanted with WT bone marrow in the ad libitum (black circle) and CR (open circle) treatment groups, and Abcg1−/− BMT ad libitum (black square) and CR (open square) groups. Symbols shown are P < 0.05 between ad libitum and CR responses at 120 min. No significant differences in glucose homeostasis was seen between mouse strains within each diet treatment group for n = 5 mice per strain.

