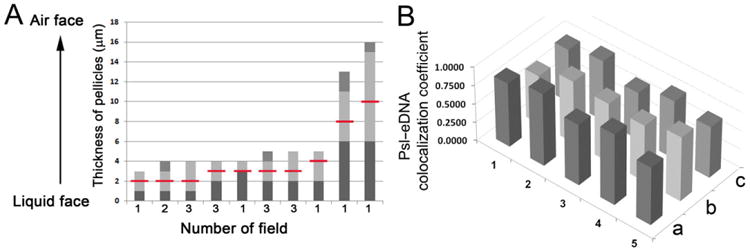
Fig. 2.

The area in pellicles found eDNA–Psl fibres and the analysis of eDNA–Psl colocalization coefficients.
A. Analysis of 19 CLSM image stacks from 2-day old pellicles showed the thickness of pellicles, the area (light grey columns) with eDNA–Psl fibres, and the location found the eDNA–Psl fibres with highest fluorescent intensity (indicated by the red lines).
B. Columns showed the eDNA–Psl colocalization coefficients analysed from five images (No #1–5) by three methods. a, Pearson's correlation coefficient; b, Manders' colocalization coefficient M1; c, Manders' colocalization coefficient M2.
