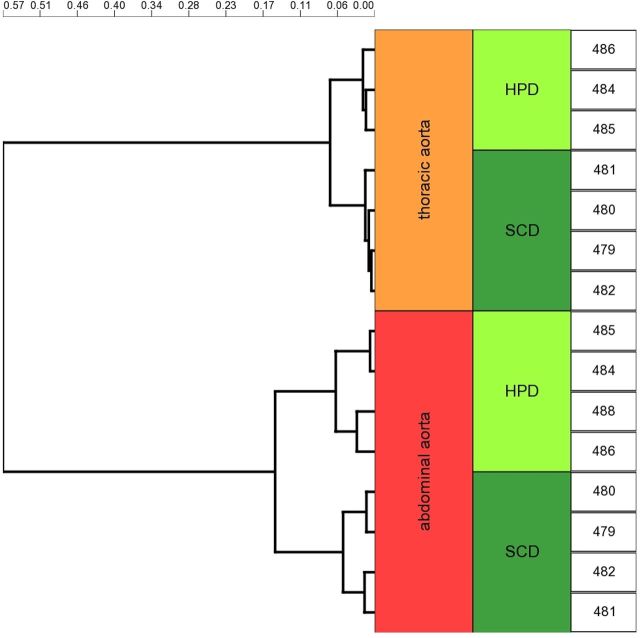
FIGURE 3:
Hierarchical cluster analysis of Affimetrix mouse gene 2.0 ST arrays of thoracic and abdominal aorta of DBA/2 mice fed with standard chow diet or high-phosphate diet. Cluster analysis on pairwise Pearson's dissimilarity of the whole transcriptome using the Ward's method revealed two prominent clusters in the dendrogram that primarily reflected the anatomical location of the tissue sample. Exposure to high-phosphate diet (HPD) or standard chow diet (SCD) was a subordinate hierarchy element in this clustering analysis. Genomic data were deposited in the NCBI gene expression and hybridization array data repository (GEO) under the GEO accession number GSE57818.

