
Figure 3.
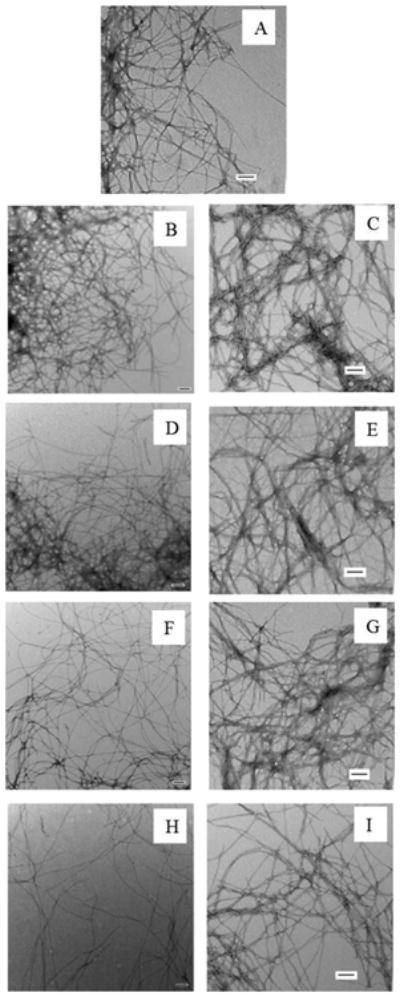
Comparison of the final products of the experiments shown in Figure 2. (A) TEM image of hIAPP. (B) TEM image of a 1:1 mixture of hIAPP and rIAPP. (C) TEM image of a 1:1 mixture of hIAPP and PM. (D) TEM image of a 1:2 mixture of hIAPP and rIAPP. (E) TEM image of a 1:2 mixture of hIAPP and PM. (F) TEM image of a 1:5 mixture of hIAPP and rIAPP. (G) TEM image of a 1:5 mixture of hIAPP and PM. (H) TEM image of a 1:10 mixture of hIAPP and rIAPP. (I) TEM image of a 1:10 mixture of hIAPP and PM. All images were collected at the end of the kinetic experiments shown in figure 2. Scale bars represent 100 nm.