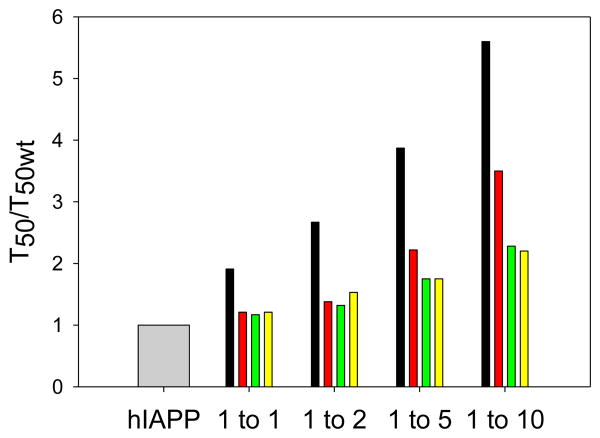
Figure 8.
Summary of the effect of the different inhibitors on amyloid formation by hIAPP. The factors by which the T50 for wild type hIAPP amyloid formation was increased are plotted as; grey, hIAPP alone; black, mixtures of hIAPP and PM at different ratios; red, mixtures of hIAPP and rIAPP at different ratios; green, mixtures of hIAPP and H18R PM at different ratios; yellow, mixtures of hIAPP and F23L PM at different ratios. Values were determined from the kinetic curves shown in figure 2 and figure 5.

