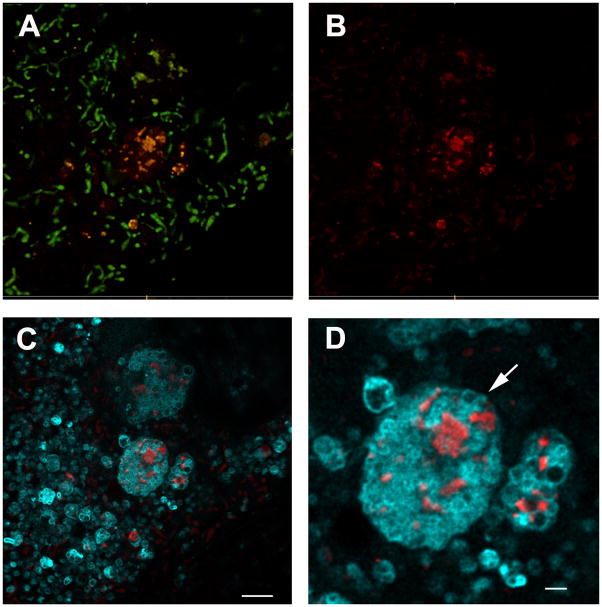
Figure 5.
Assessment of mitophagy using mt-Keima and Stimulated Emission Depletion (STED) microscopy. A) Representative STED image of mt-Keima MEFs showing merged red and green fluorescence. B) The red only mt-Keima signal. C) Merged red mt-Keima signal with LysoSensor fluorescence (depicted in Cyan; scale bar=2 μm). D) Higher magnification of the mt-Keima red signal within lysosomes. Arrows indicate what appears to be a recently ingested autophagosome decorated with mt-Keima and contained within a presumed newly formed autolysosome (scale bar=1 μm).

