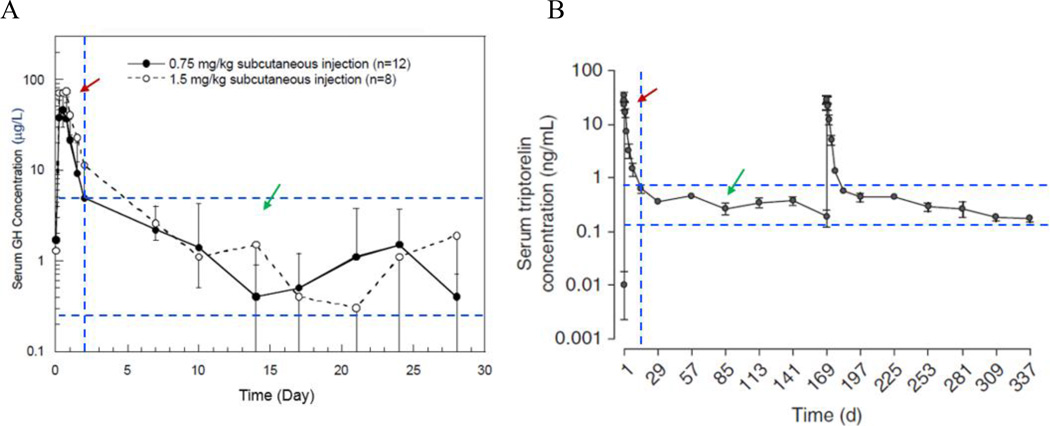
Figure 1.
Examples of pharmacokinetic profiles of Nutropin Depot (A) and Trelstar (B) (obtained from the packaging inserts). The red arrow indicates the PK region resulting from the initial burst release of a drug, and the green arrow indicates the PK region of the therapeutically effective drug concentrations.

