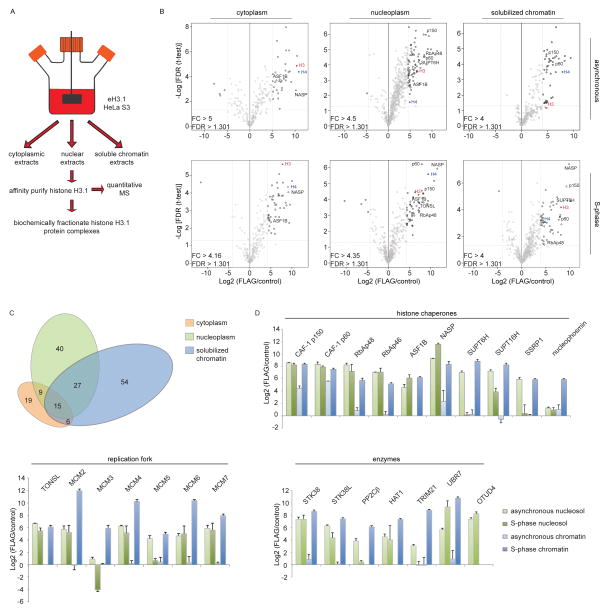
Figure 1.
Quantitative mass spectrometry (MS) analyses of H3.1-interacting proteins. (A) Purification Scheme. (B) Quantitative MS analysis of affinity-purified eH3.1 isolated from asynchronous or synchronized, replicating cells. Each volcano plot represents three independent eH3.1 (FLAG) pull-downs plotted against matching mock purifications. The x axis denotes the eH3.1 over mock ratio of MS intensity whereas a false discovery rate (FDR) adapted t-test is plotted on the y axis. (C) Distribution of H3.1-interacting proteins across subcellular compartments. (D) Relative enrichment of histone chaperones, components of the replication fork, and proteins with enzymatic activity within the eH3.1 immunoprecipitates. Data is presented as mean Label-free Quantification (LFQ) ratio +/− SD.

