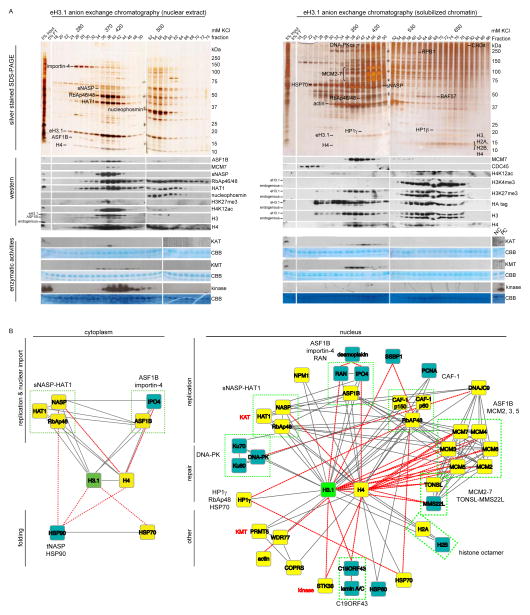
Figure 2.
Biochemical isolation of soluble eH3.1 protein complexes. (A) Anion exchange chromatography of eH3.1 affinity purified from either nuclear extracts (left panel) or solubilized chromatin (right panel). Silver stained SDS-PAGE and western analyses revealed co-eluting proteins (top panels), whereas the extracts were further essayed for intrinsic enzymatic activities towards histones using radiolabeled acetyl-CoA, SAM and ATP (bottom panels). The elution points above the gels denote fractions where eH3.1 protein levels peaked. These fractions, as well as fractions containing enzymatic activities towards histones were further fractionated (see Figure S2, Figure S3). (B) H3.1 interactome based on the biochemical purification of soluble eH3.1 protein complexes. Proteins validated in the quantitative MS analysis are highlighted in yellow. Solid grey and dashed red lines respectively represent interactions reported in STRING, and interactions found through the biochemical purification of soluble eH3.1. NC: negative control, PC: positive control, KAT: lysine acetyltransferase, KMT: lysine methyltransferase, CBB: Coomassie Brilliant Blue.

