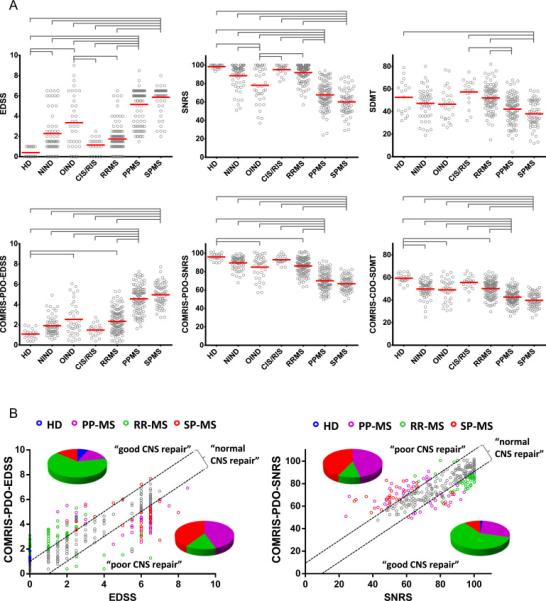
Figure 3. COMRIS provides novel insight about diagnostic subgroups of neurological diseases.

(A) Evaluation of clinical scores and COMRIS-predicted clinical scores (EDSS, SNRS, and SDMT) between diagnostic subgroups. Gray brackets highlight statistically significant differences between seven diagnostic subcategories with adjusted p<0.001. The data (gray circles) are depicted with means (red bars). (B) Correlation between clinically-measured and COMRIS-predicted disability scores (EDSS and SNRS) identifies a group of subjects characterized by lower clinical disability than predicted by the amount of CNS tissue destruction observed on MRI (“good CNS repair”) and a group of subjects with higher clinically measured disability than predicted by MRI (“poor CNS repair”) for both EDSS and SNRS. The black dashed lines identify subjects (grey circles) with “normal CNS repair” with predicted disability within 10% of clinically measured disability. Subjects with good and poor CNS repair are color-coded based on their diagnosis (blue – HD, magenta – PPMS, green – RRMS, red – SPMS), the pie-charts show distribution of diagnoses for subjects with poor or good CNS repair for both EDSS and SNRS. Abbreviations: HD = healthy donors, NIND = non-inflammatory neurological disorders, OIND = other inflammatory neurological disorder, CIS/RIS = clinically-/radiologically isolated syndrome, RRMS = relapsing-remitting multiple sclerosis, PPMS = primary progressive multiple sclerosis, SPMS = secondary progressive multiple sclerosis, EDSS = expanded disability status scale, SNRS = Scripps neurological rating scale, SDMT = symbol digit modalities test, COMRIS-PDO-EDSS = combinatorial MRI scale – physical disability optimized by EDSS, COMRIS-PDO-SNRS= combinatorial MRI scale – physical disability optimized by SNRS, COMRIS-CDO-SDMT = combinatorial MRI scale – cognitive disability optimized by SDMT
