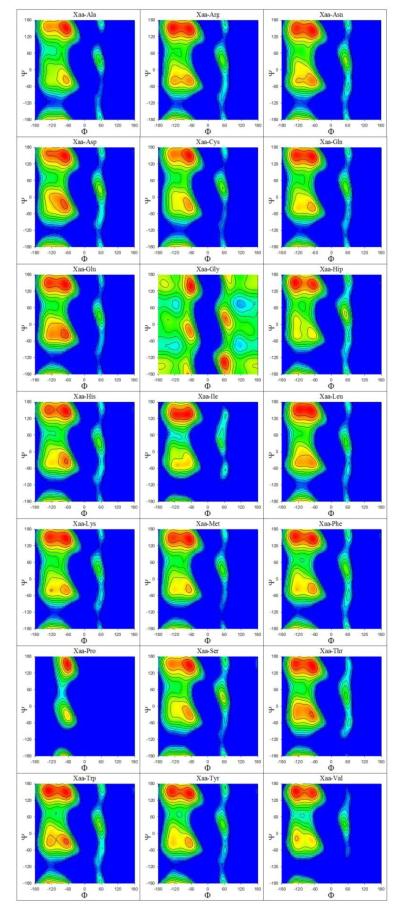
Figure 6. Average Ramachandran maps at the C-terminus.
Plots showing simulation Ramachandran maps expressed in free energy form for all 21 types of amino acids averaged over all possible N-terminal residues excluding Pro and Gly. Map at top-left, for example, shows the average Ramachandran map of the C-terminal Ala in all peptides of the form Ala-Ala, Cys-Ala, Gln-Ala, Glu-Ala, etc. Free energies are colored in descending order from blue to red.

