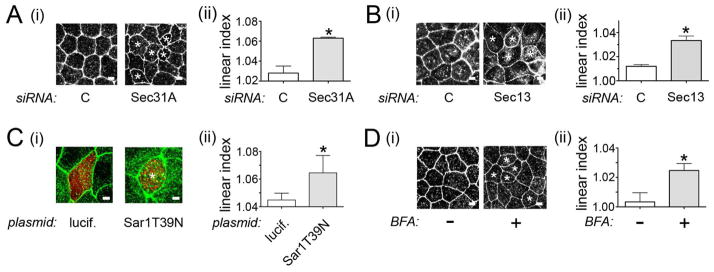
Figure 7. COPII components regulate apical junction morphology.
A. Effect of depletion of Sec31A on cell junctions. (i). About 72 h after transfection with control siRNA or an siRNA targeting Sec31A, Caco-2 BBE1 cells were fixed and labeled for the tight junction protein ZO-1. Images of ZO-1 labeling were acquired using a confocal microscope. (ii). Linear indexes were quantified as described in the Experimental Procedures. B. Impact of Sec13 depletion on cell junctions. Transfection, imaging of cell junctions (i), and measurement of linear indexes (ii) was performed as described in A. C. Perturbation of cell junctions by a dominant negative allele of Sar1. Caco-2 BBE1 cells transfected with plasmids expressing Ha-tagged Sar1.T39N or luciferase for 72 h were fixed and labeled for Ha (red) and ZO1 (green). Images of ZO-1 labeling (i) and linear index values (ii) are shown. D. Effect of BFA on cell junctions. Caco-2 BBE1 cells were treated with 5 μg/ml BFA for 2 h, followed by processing for confocal microscopy. Images of ZO-1 labeling (i) and quantification of linear indexes (ii) are shown. Asterisks in A–D indicate cells with curved junctions. Scale bars represent 3 μm. Linear index data in A–D are mean+/− SEM values from three experiments. *, P < 0.05 relative to control siRNA (C) treated cells.

