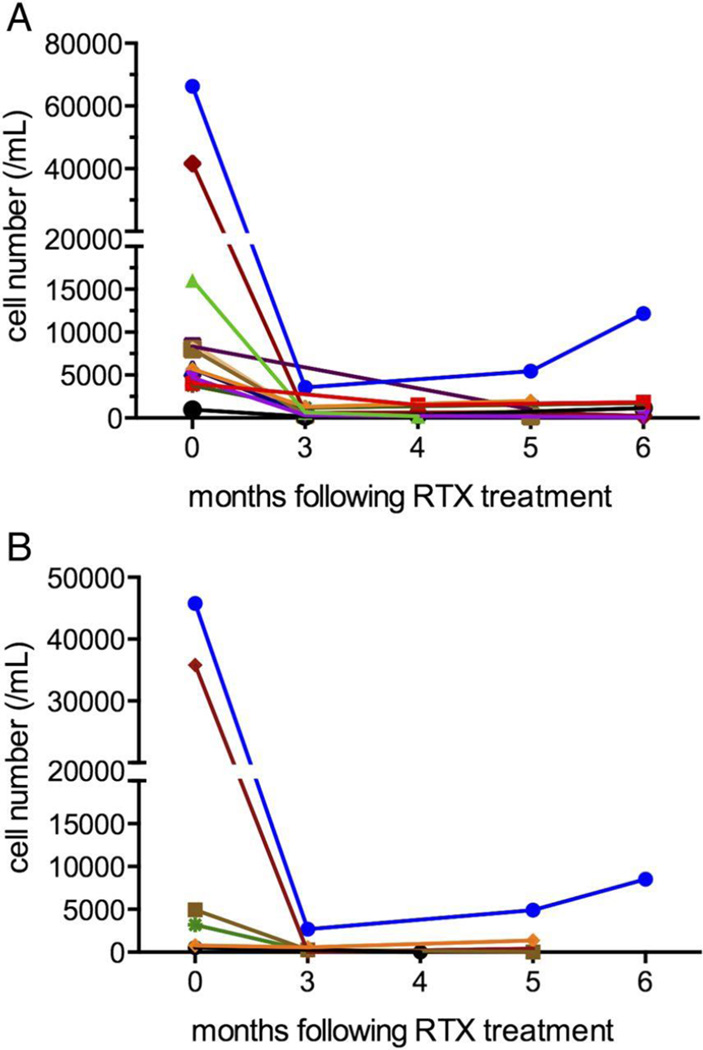
Figure 2.
(A) Absolute plasmablast count (/mL) at baseline (month 0) and following rituximab (RTX) infusions. Each line represents a different patient (n=12 patients). (B) Absolute IgG4+ plasmablast count (/mL) at baseline (month 0) and following RTX infusions. Each line represents a different patient (n=6 patients). The same colour is used for these six patients as in figure 2(A).

