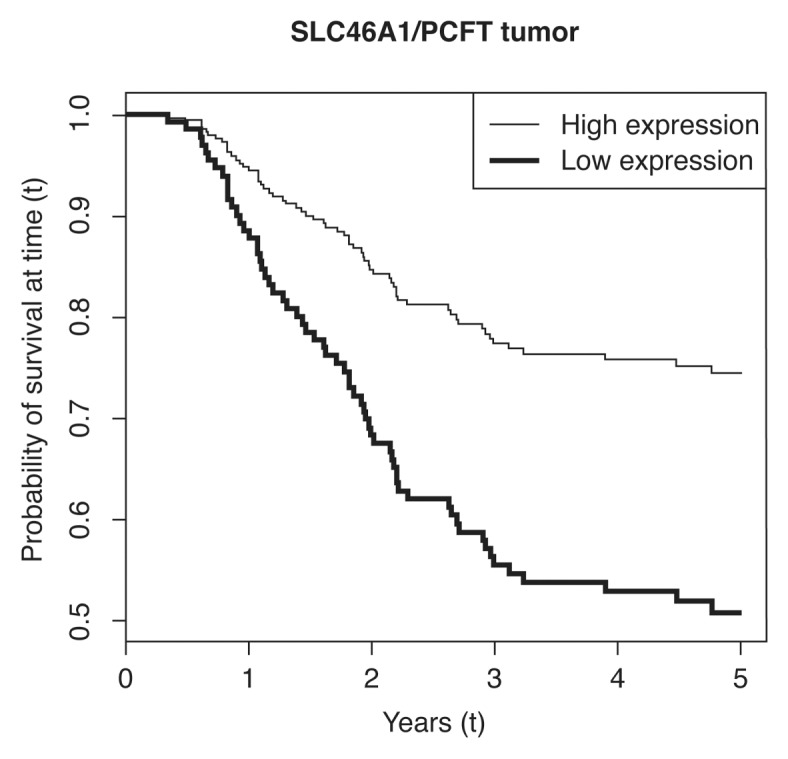
Figure 2.

Estimated survival functions by level of SLC46A1/PCFT gene expression in colorectal cancer tissue. The two curves show predicted survival functions for the fitted Cox proportional hazards models. The expression levels for the two curves have been set one standard deviation above and one standard deviation below the mean, where one standard deviation corresponds to a fold change in log expression levels of 1.57. Lymph node ratio has been set to its mean, and adjuvant therapy has been set to 5-fluorouracil plus leucovorin, as this was the treatment given to most the patients. Standard deviations and mean for expression levels have been calculated from ΔCt values.
