Figure 1.

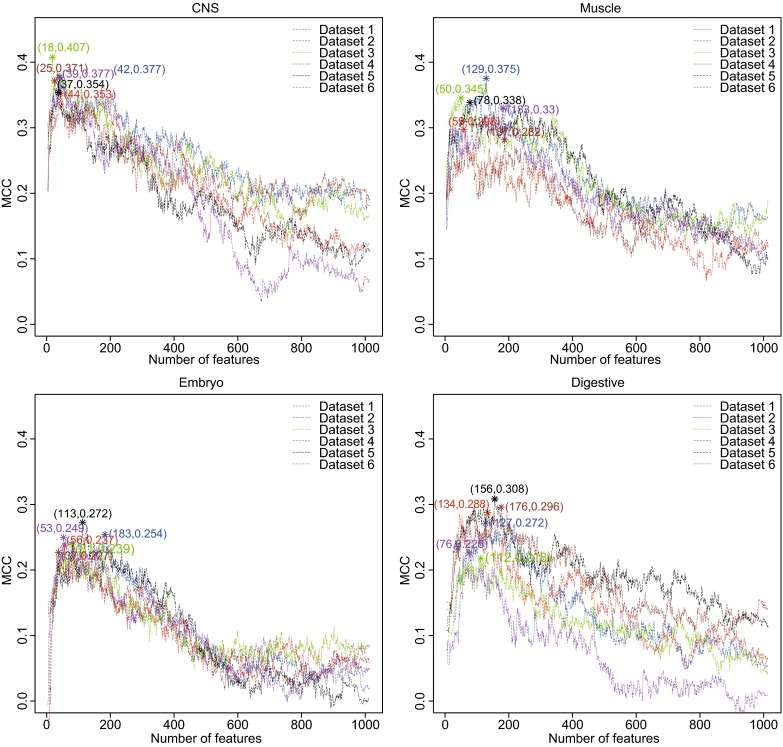
The IFS curves in four tissues. The x axis was the number of features and the y axis was the 10-fold cross validation MCC. The features achieved the highest MCC were selected as key features

The IFS curves in four tissues. The x axis was the number of features and the y axis was the 10-fold cross validation MCC. The features achieved the highest MCC were selected as key features