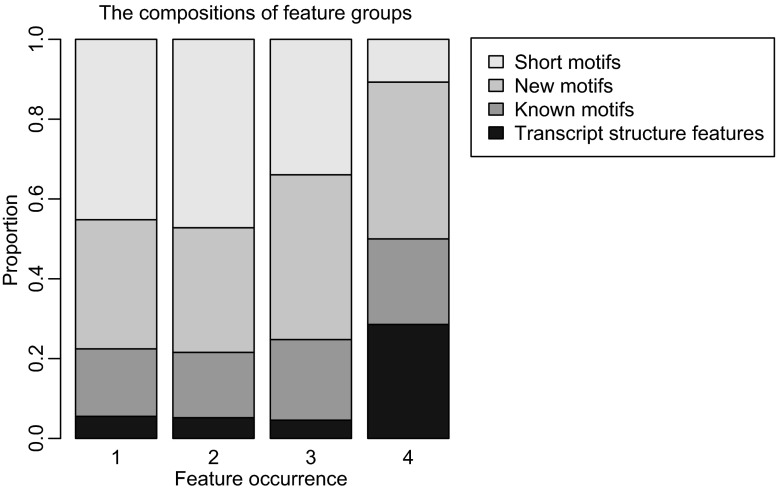
Figure 2.
The compositions of different feature groups with different occurrences. The horizontal axis indicates the occurrences for features across tissues. “1” means the number of features that are only occurred in one tissue. “2” means the number of features that are discovered in two tissues and so on

