Fig. 4.

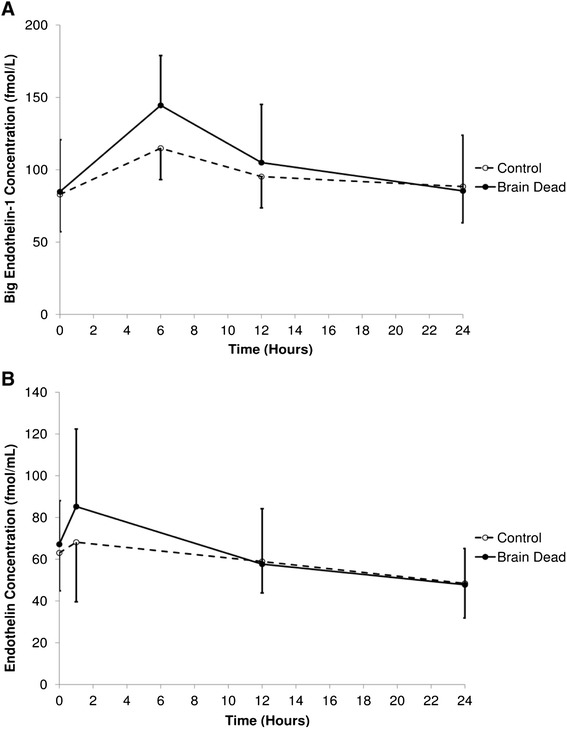
ELISA analysis of the endothelin axis. a Big endothelin concentrations. b endothelin-1 concentrations. Samples measured in EDTA plasma. Sheep 6 has been excluded from this analysis (brain dead group) due to technical errors in measurement

ELISA analysis of the endothelin axis. a Big endothelin concentrations. b endothelin-1 concentrations. Samples measured in EDTA plasma. Sheep 6 has been excluded from this analysis (brain dead group) due to technical errors in measurement