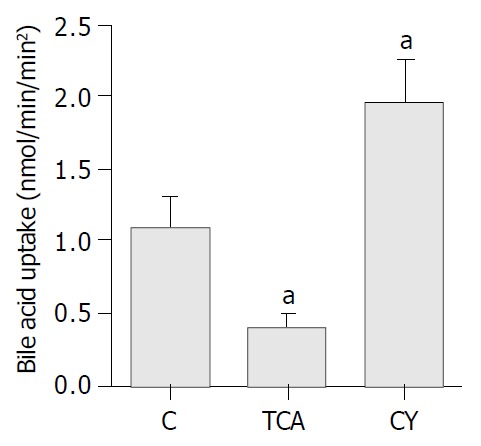
Figure 5.

Effect of TCA and CY feeding on taurocholate uptake by ASBT in rat IBDUs. Bar graphs showing 2.7-fold decrease and 1.7-fold increase in taurocholate uptake in TCA and CY fed rats, respectively, compared to controls. Data shown here, and expressed as mean ± SE, were obtained from n = 3 feeding stud-ies in which 11 control, 4 TCA and 5 CY IBDUs were analyzed (aP < 0.05).
