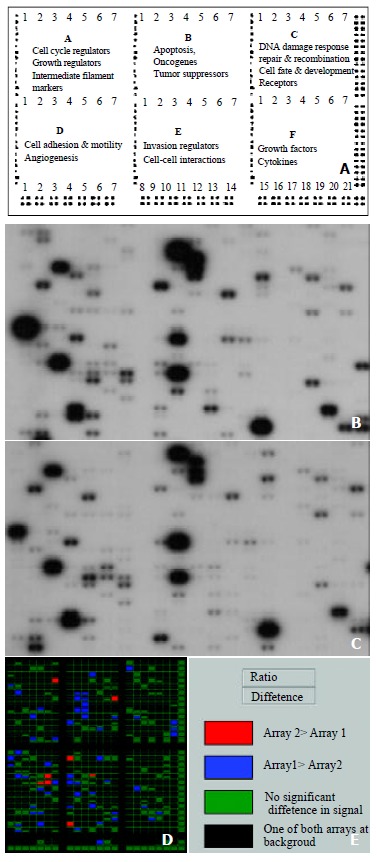
Figure 1.

Parallel analysis of gene expression profiles in human gastric carcinoma and adjacent normal gastric mucosa. The schematic diagram of Atlas human cancer expression array contains 588 cancer-related human cDNA spotted as duplicates. Nine housekeeping genes are spotted at the bottom line to serve as positive controls. Dark grey spots at the outer end of the array represent genomic DNA spots, which serve as orientation marks (A). Atlas human cancer cDNA expression array (Clontech, USA) was hybridized with 32P-labeled cDNA probes obtained from total RNA of human gastric carcinoma (B) and adjacent normal gastric tissues (C). The colorful compare diagram between human gastric carcinoma and adjacent normal gastric tissues was got when you aligned two arrays to AtlasImage Grid Temples and adjusted the alignments and background calculations (D). Definitions of colors in the array comparison were showed (E).
