Figure 6.

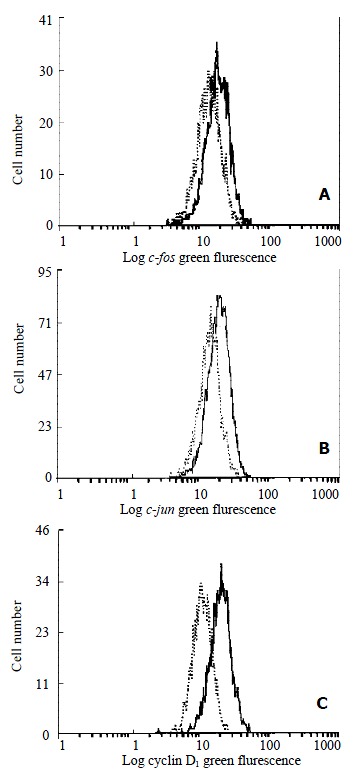
Flow cytometric analysis of c-fos (A), c-jun (B) and cyclin D1 (C) expression in HSC. -indicated the control HSC and -indicated HSC treated with 10-7 mol/L genistein for 48 h.

Flow cytometric analysis of c-fos (A), c-jun (B) and cyclin D1 (C) expression in HSC. -indicated the control HSC and -indicated HSC treated with 10-7 mol/L genistein for 48 h.