Figure 1.

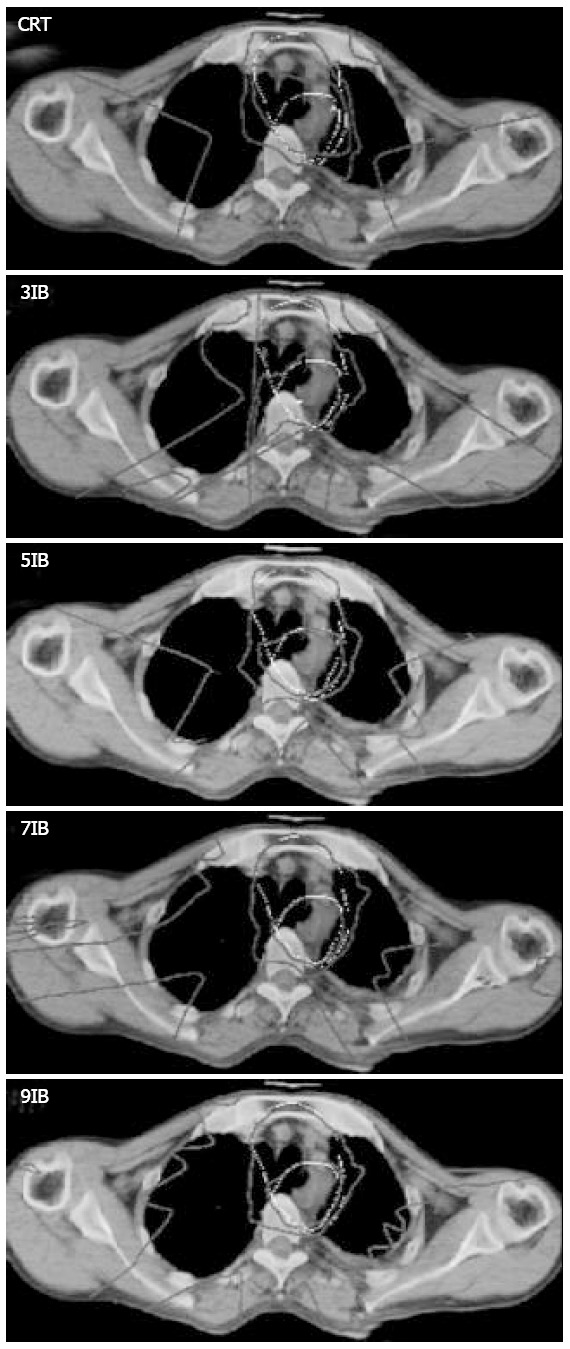
Isodose distributions on axial images for CRT and IMRT plans of patient 3. The white lines represent PTV1 and PTV2. PTV1 was inside PTV2. The isodose levels of 67.2 Gy, 50.4 Gy and 20 Gy were shown. IB stands for intensity-modulated beam.

Isodose distributions on axial images for CRT and IMRT plans of patient 3. The white lines represent PTV1 and PTV2. PTV1 was inside PTV2. The isodose levels of 67.2 Gy, 50.4 Gy and 20 Gy were shown. IB stands for intensity-modulated beam.