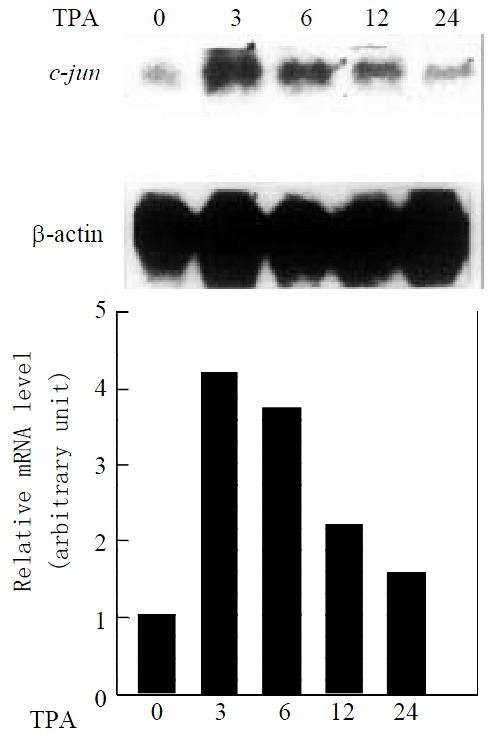
Figure 2.

Expression of c-jun mRNA in response to TPA induction. Cells treated with TPA for different time indicated. Expression of c-jun mRNA was revealed by Northern blot. The same membrane was probed again with β-actin cDNA to show the amount of RNA used in each well. The intensity of each band was quantified by densitometer.
