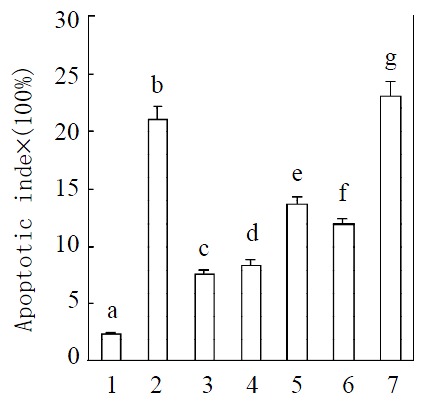
Figure 6.

Induction of apoptosis after treatment with TNFα. Means of data shown in figure were: 1. Control; 2. Treated with TNFα at 10 μg·mL-1; 3. Treatment with TNFα at 10 μg·mL-1 after treated with plasma membrane purified from liver at 36 h after partial hepatectomy at 2 μg·mL-1; 4. Treated with plasma membrane at 2 μg·mL-1 purified from hepatocytes induced with TNFa accompanied with TNFa at 10 μg·mL-1; 5. Treated with PMA at a concentration of 10 μmol·L-1 (in DMSO) accompa-nied with TNF at 10 μg·mL-1; 6. Treated with serum from rat after partial hepatectomy for 36 h at 5% accompanied with TNFα at 10 μg·mL-1; 7. Treated with TNFα at 10 μg·mL-1 after treated with plasma membrane purified from rat liver regen-erated for 2 months at 2 μg·mL-1. Apoptotic index = (numbers of apoptotic cells/total cells numbers per well) × 100. Data were means from 6 separate experiments × SE (n = 6 wells). Differ-ent letters over bars indicate significant differences, P < 0.05. The results are confirmed by DNA fragmentation by agarose electrophoresis (data not provided).
