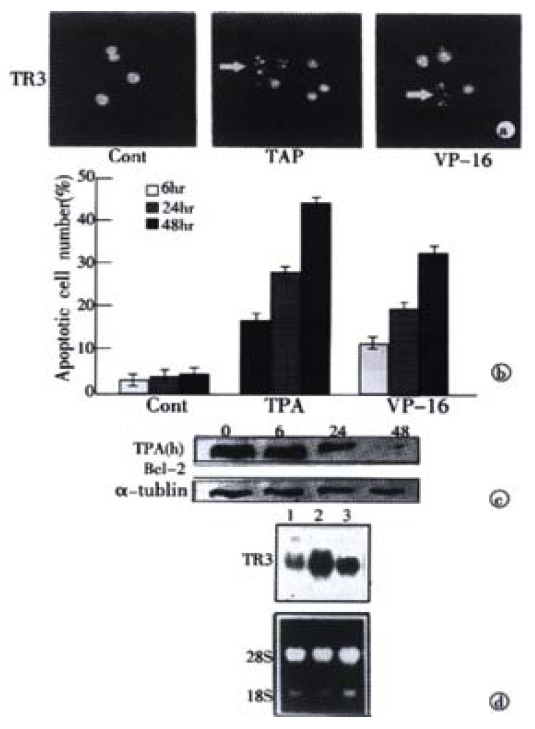
Figure 1.

Induction of apoptosis and TR3 expression induced by TPA and VP-16 in MGC80-3 cells. (A) Morphological analysis of apoptotic cells. Cells treated with TPA and VP-16 for 24 hr, and then stained with DAPI. Nuclear mor-phology was visualized under fluorescence microscope. (B) Measure of apoptotic index by counting 1000 cells stained with DAPI under fluorescence microscope. The data shown represents mean of three independent experiments (± SE). (C) Analysis of Bcl-2 protein expression. Cells were treated with TPA for indicated time, and Western blot was preformed as described in materials and methods. α-tubulin was used to quantify the amount of protein used in each lane. (D) Detection of TR3 mRNA expression. Cells were treated with TPA and VP-16 for 24 hr. Preparation of total RNA and Northern blot were carried out as described in materials and methods. 18S and 28S were shown to quantify the loading RNA. Lane 1: control; Lane 2: TPA treatment; Lane 3: VP-16 treatment.
