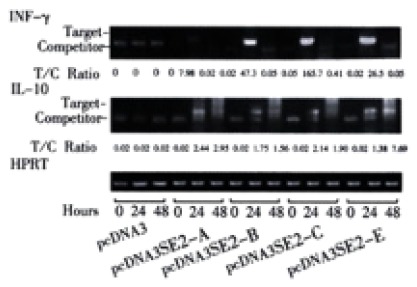
Figure 5.

IFN-γ and IL-10 mRNA expression. mRNA was isolated from splenic cells of immunized mice after stimulation with HBsAg for 0, 24, 48 hours. IFN-γ and IL-10 mRNA expression was determined by semi-quantitative RT-PCR after standardization of the cDNA concentration by amplification of HPRT. Level of expression is indicated as ratio of target to competitor, calculated from densitometric analysis of their PCR products. (High ratio indicates high expression of target mRNA).
