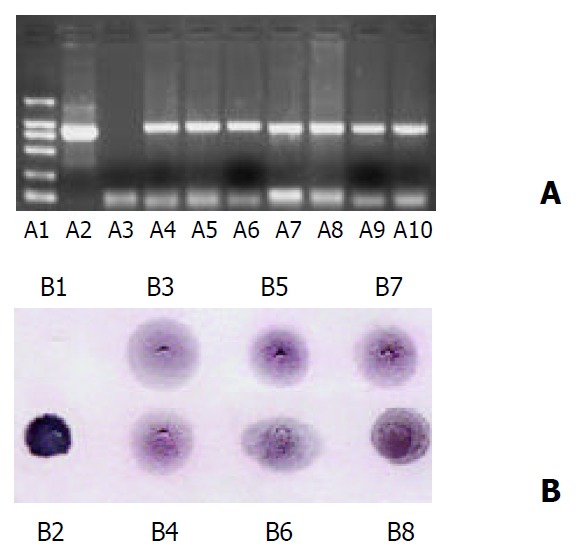
Figure 4.

Analysis of HEV-E2 gene integration. A: PCR amplifi-cation of genomic DNA of tomato plants, B: Southern dot blot-ting of genomic DNA of tomato plants. A1: DL-2000 marker, A2: Positive control (p1301E2), A3: Total DNA of wild-type con-trol plant, A4-A10: Total DNA of independent transformants. B1: Total DNA of wild-type control plant, B2: Positive control (p1301E2), B3-B8: Total DNA of independent transformants.
