
Figure 2.
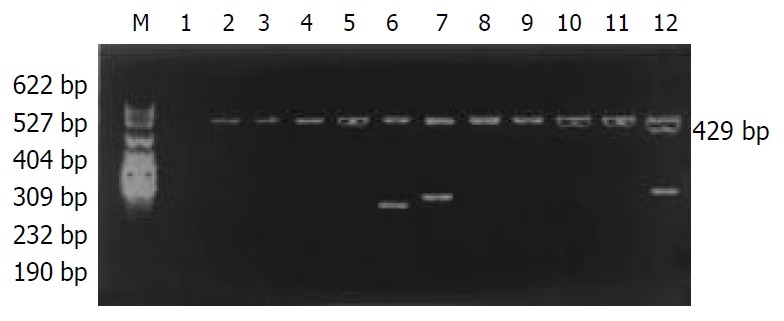
Electrophoresis of HLA-DQA1 alleles amplification by PCR/SSP. M: pBR322DNA/MSPImarker, 1: negative control, 2: 0101/0104, 3: 0101/0102/0104, 4: 0102/0103, 5: 0103, 6: 0201, 7: 0301, 8: 0302, 9: 0401, 10: 0501, 11: 0601, 12: A (when the ampli-fication product was -DQA1*0104, “A” was negative. When the amplification product was non-DQA1*0104, “A”was positive.).