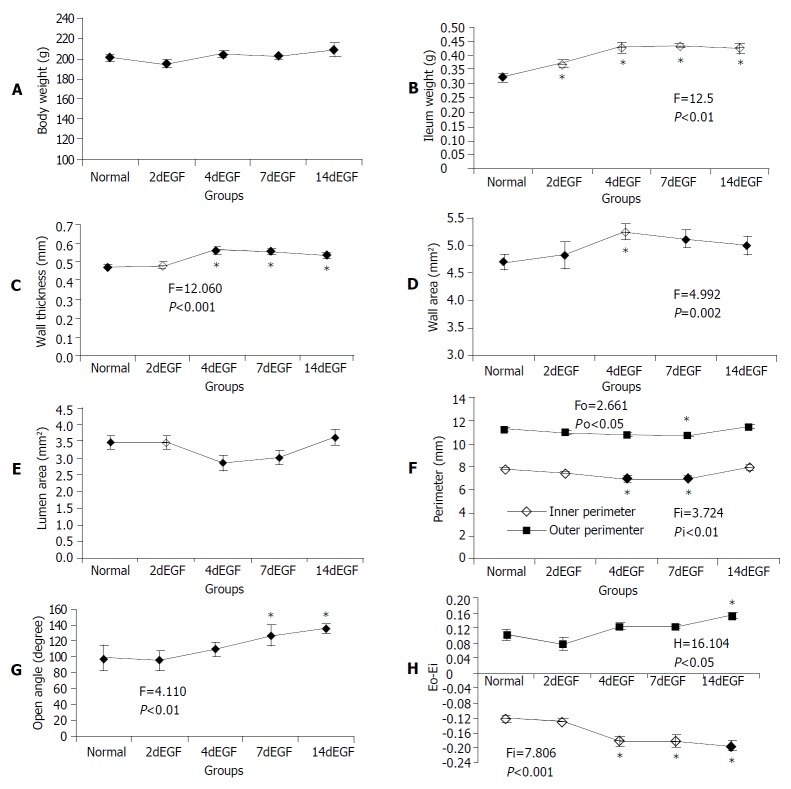
Figure 3.
Legend, morphometric data of ileum in the no-load (A-F) and zero-stress states (G-H). F and P values were from one-way ANOVA for different treatment groups: If significant difference (P < 0.05) was found using one-way ANOVA (marked with a), multiple comparisons with normal controls were done using Dunnet’s test. Significantly different groups were marked with b.

