
Figure 2.
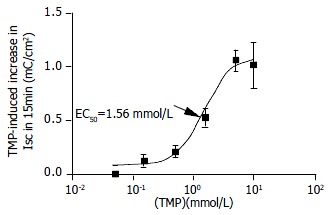
Concentration-response curve for TMP-induced ISC in CAPAN-1 cells. Different concentrations of TMP were added to basalateral side. Each data point was obtained from at least 4 individual experiments. Arrow shows EC50.
Official websites use .gov
A
.gov website belongs to an official
government organization in the United States.
Secure .gov websites use HTTPS
A lock (
) or https:// means you've safely
connected to the .gov website. Share sensitive
information only on official, secure websites.
Concentration-response curve for TMP-induced ISC in CAPAN-1 cells. Different concentrations of TMP were added to basalateral side. Each data point was obtained from at least 4 individual experiments. Arrow shows EC50.