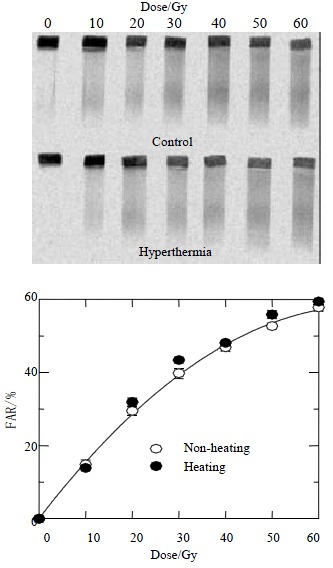
Figure 3.

Dose response curves for HepG2 cells received radiation combined with or without hyperthermia. The upper panel shows a typical gel scanned with 14C-TdR, while the lower panel shows quantitative data as described in the Methods. The FAR increases almost linearly with dose up to 30 Gy but bends downward at higher doses. Similar increases in FAR as a function of dose are observed in radiation alone or combined with hyperthermia, suggesting similar yields of DNA DSBs.
