
Figure 3.
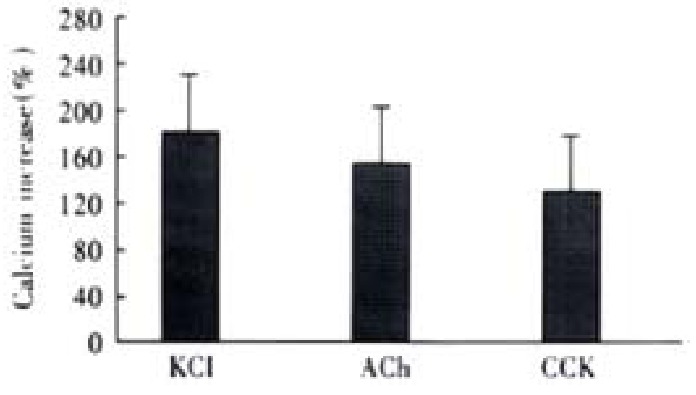
Intracellular fluorescence increases induced by different agonists. Ca2+ Concentration increased from resting level of 108 ± 21 nmol·L-1 to 297 ± 66 nmol·L-1, 275 ± 58 nmol·L-1 and 251 ± 45 nmol·L-1, respectively. ANOVA was performed for the analysis, F = 0.9184, no significant difference be-tween three groups (n = 4).