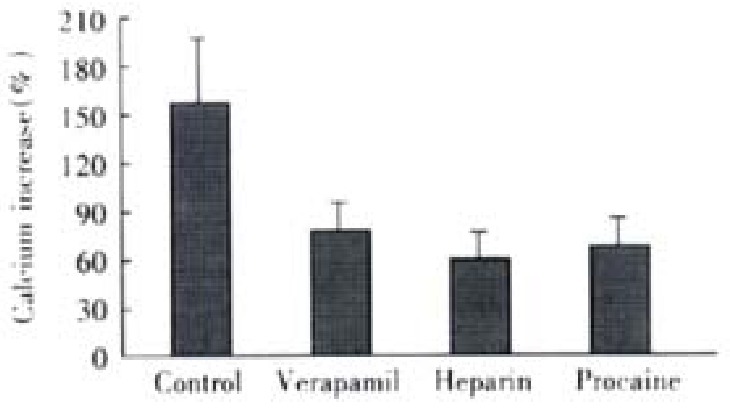
Figure 4.

Effect of different antagonists on ACh induced cellular Ca2+ increase (-x ± S-x, n = 4). Maximal Ca2+ concentration increased to 192 ± 22 nmol·L-1,175 nmol·L-1 ± 26 nmol·L-1 and 186 ± 30 nmol·L-1, respectively. ANOVA was performed for the analysis, F = 1.324, with no significant difference be-tween the three experimental groups (n = 4 ).
