
Figure 5.
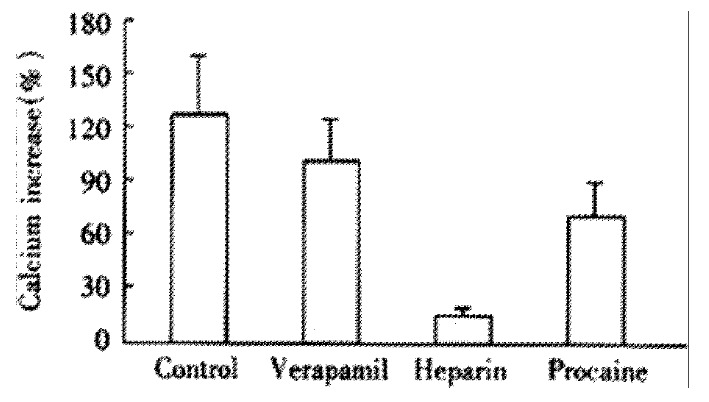
Effect of different antagonists on CCK induced cellular Ca2+ increase (-x ± S-x, n = 4). Maximal Ca2+concentration increased to 220 ± 26 nmol·L-1, 133 ± 21 nmol·L-1 and 201 ± 40 nmol·L-1, respectively. SNK-q test was performed, there was a statistical difference between heparin treated group and other two groups, P < 0.01.