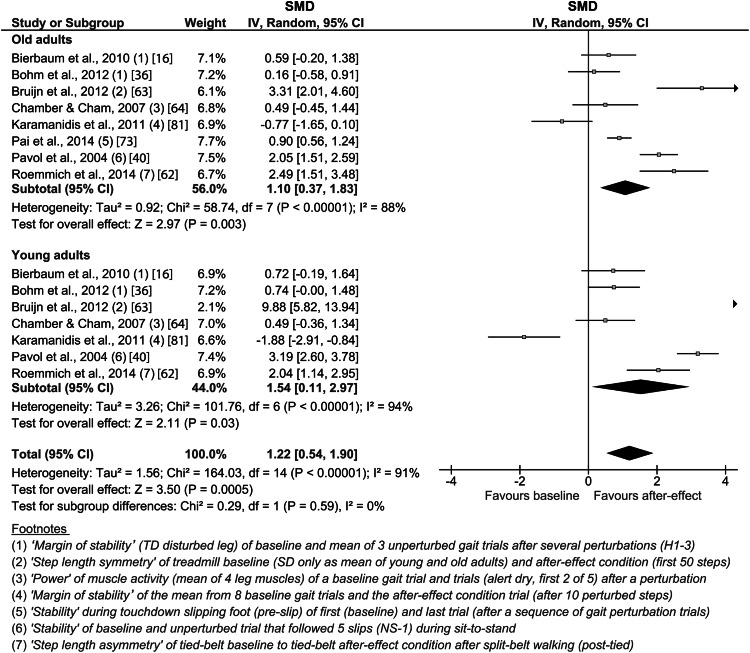
Fig. 3.
Forest plot of the effect of predictive adaptation on locomotion. The footnotes explain the data from the original study used for the present analysis. CI confidence interval, H hard surface (unperturbed), IV inverse variance, NS-1 non-slip trial (unperturbed), SD standard deviation, SMD standardized mean difference, TD touchdown

