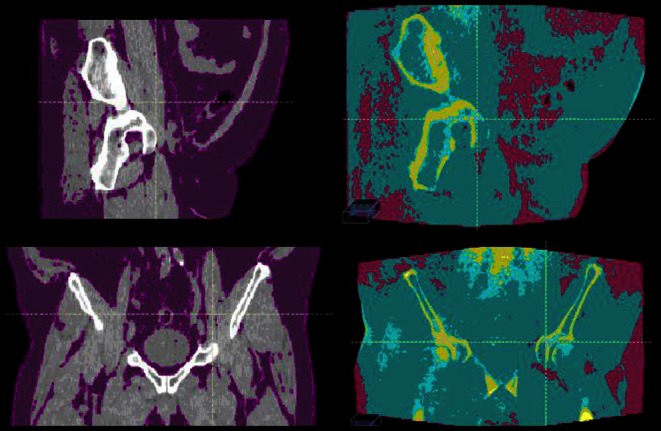
Fig. 4.

Sagittal (top row) and coronal slices (bottom row) of a pelvic case with a high proportion of adipose tissue. From left to right: the PCTCBCT with tissue density < 0.95 g/cm3 colored purple, and CBCT with RSauto CTN adjustment. In the CBCT images purple, turquoise, and yellow represent adipose (0.95 g/cm3), connective tissue (1.05 g/cm3), and bone (1.6 g/cm3), respectively. PCT planning computed tomography, CBCT cone beam CT, CTN CT number
