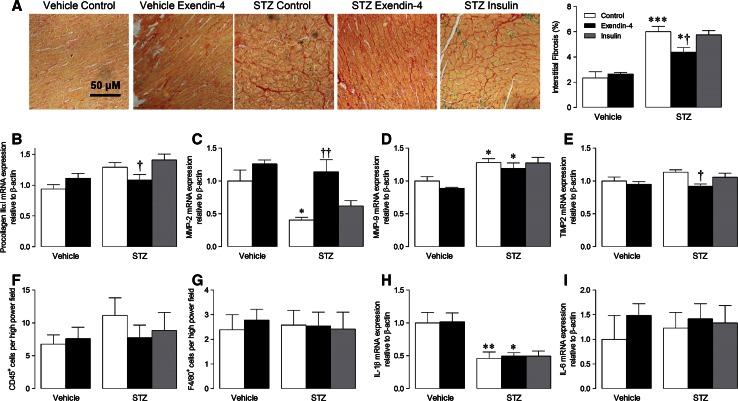
Fig. 2.
Effect of exendin-4 on ECM remodelling and myocardial inflammation after 12 weeks STZ diabetes. a Representative LV sections stained with picrosirius red to assess interstitial fibrosis and quantification data (n = 6–13). b–e, h, i mRNA expression of ECM genes/cytokines in LV tissue (n = 5–8). f–g Quantification of LV sections probed for CD45 and F4/80 to assess leukocyte and macrophage infiltration, respectively (n = 4–8). White columns control; black columns exendin-4; grey columns insulin; mean ± SEM. *P < 0.05; **P < 0.01; ***P < 0.001 versus corresponding vehicle; † P < 0.05; †† P < 0.01 versus corresponding control

