
Figure 1.
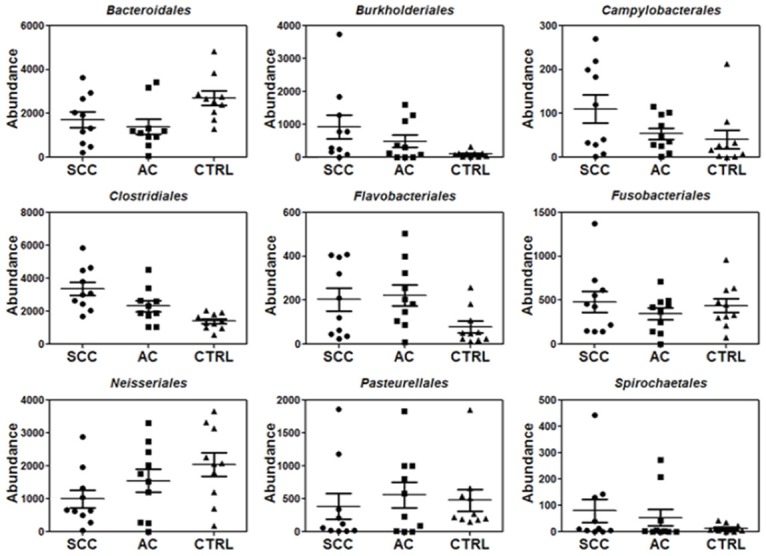
Relative abundance for a partial list of salivary bacteria at the order level among SCC, AC and control groups (n=10 each group).
Official websites use .gov
A
.gov website belongs to an official
government organization in the United States.
Secure .gov websites use HTTPS
A lock (
) or https:// means you've safely
connected to the .gov website. Share sensitive
information only on official, secure websites.
Relative abundance for a partial list of salivary bacteria at the order level among SCC, AC and control groups (n=10 each group).