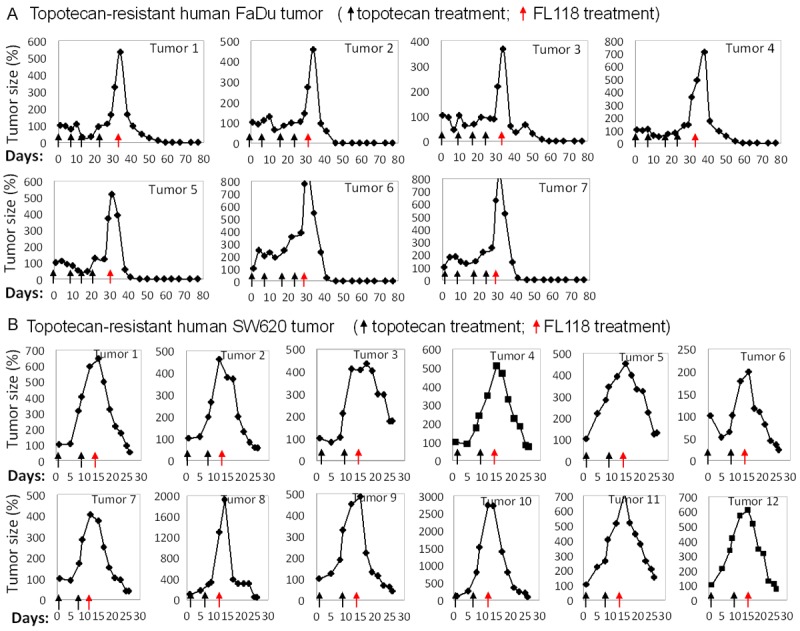
Figure 3.

FL118 effectively regresses human tumor that acquired topotecan-resistance: (A) Human FaDu tumor animal model establishment and treatment starting day same as in Figure 2. Tumor mice were first treated with topotecan at its MTD (4 mg/kg, IP) with daily × 5 schedules for 4 cycles (each black arrow is one cycle). After tumors acquired topotecan resistance, mice were then treated with FL118 as in Figure 2 (q2d × 5, red arrow). Tumor curves are shown as individual tumor profiles after drug treatment. Of note, 2 FaDu tumors did not acquire topotecan-resistance after 4-cycle topotecan treatment (data not shown). (B) Mouse models of SW620 tumors were established as in Figure 2. Topotecan treatment (black arrow) was performed as in (A) until obtaining resistant tumor (tumor grows while treating), followed by FL118 treatment (q2d × 5, red arrows) at 1 mg/kg (2/3 MTD, top panel) and 0.75 mg/kg (1/2 MTD, bottom panel). Tumor curves were derived from individual tumor profiles after drug treatment. Tumor mice without drug treatment were sacrificed within two weeks due to tumor size over 1500 mm3.
