
Figure 3.
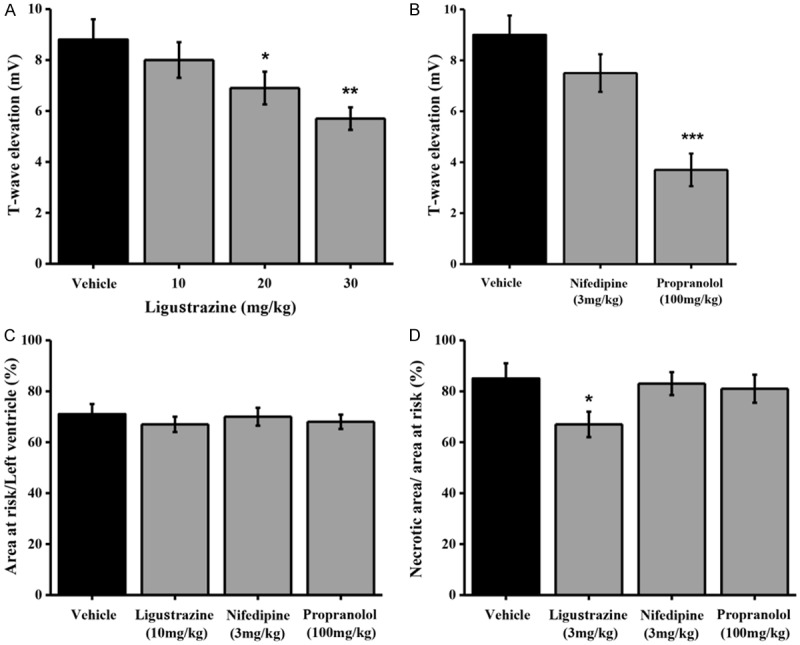
Effects of ligustrazine on the T-wave elevation and myocardial infarct size induced by coronary artery occlusion in anesthetized rats. A. Means ± SEM ligustrazine and vehicle on the T-wave elevation induced by coronary artery occlusion in anesthetized rats. Ligustrazine was administered orally 30 min prior to coronary artery occlusion. Columns indicate the maximal T-wave elevation induced by coronary artery occlusion. n=8-10. *p=0.0258 and **p=0.0017, different from this in the vehicle. B. Means ± SEM nifedipine, propranolol and vehicle on on the T-wave elevation induced by coronary artery occlusion in anesthetized rats. Nifedipine (3 mg/kg) and propranolol (100 mg/kg) were administered orally 1 hour prior to coronary artery occlusion. Columns indicate the maximal T-wave elevation induced by coronary artery occlusion. n=8-9. ***p=0.0002, different from this in the vehicle. C. Means ± SEM ligustrazine, nifedipine, and propranolol on myocardial infarct size after 40 min of coronary artery occlusion and in rats. Drugs were administered orally 30 min (ligustrazine) or 1 hour (nifedipine and propranolol) prior to coronary artery occlusion. Columns indicate the myocardial infarct size induced by coronary artery occlusion. n=8-10. *p=0.0193, different from this in the vehicle. D. Means ± SEM ligustrazine, nifedipine, and propranolol on myocardial infarct size after 24 h of coronary artery occlusion and reperfusion in rats. Drugs were administered orally 30 min (ligustrazine) or 1 hour (nifedipine and propranolol) prior to coronary artery occlusion. Columns indicate the myocardial infarct size induced by coronary artery occlusion. n=8-11. *p=0.0324, different from this in the vehicle.