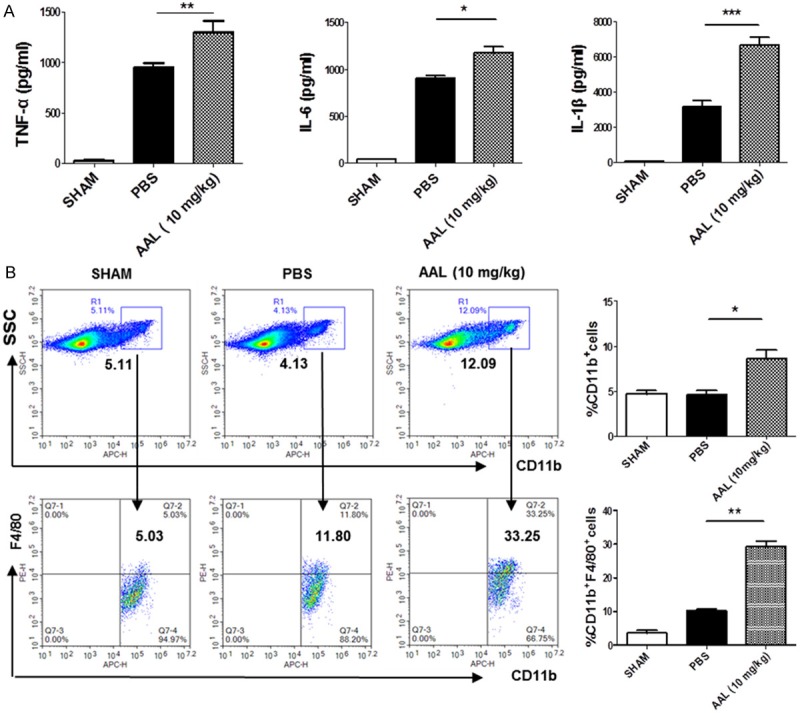
Figure 2.

Serum cytokine levels in animals after CLP induction and the impact of AAL on macrophage recruitment. A. Serum levels for TNF-α, IL-6 and IL-1β 48 h after CLP induction. B. Flow cytometry analysis of splenic macrophages. Spleens were collected 48 h after CLP induction and then subjected to flow cytometry analysis. The cells were first gated for CD11b followed by analysis of F4/80+ cells. Left: a representative data for flow cytometry; right: a bar graphic figure showing the data with 5 replications. All data were expressed as mean ± SEM and analyzed by two-way ANOVA followed by Bonferroni test. *P < 0.05, **P < 0.01, ***P < 0.001 as compared with the values in PBS group.
