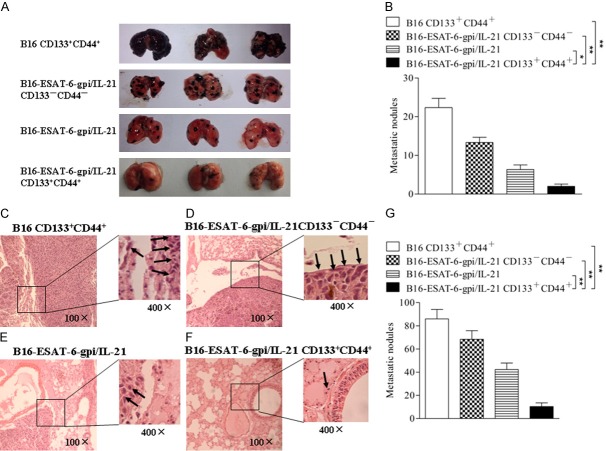
Figure 3.
Evaluation of tumor lung metastasis by observation of tumor nodes and histological analysis. A. Images of tumor metastatic nodes in mouse lungs. B. The quantification analysis of lung tumor metastatic node counts. C-F. Tissue sections derived from the different vaccine immunized mice 40 days after challenged with the B16F10 cells, respectively. The arrows point to the metastatic focus (400×). G. Quantitative analysis of the tumor metastatic focus in lungs. *p<0.05, **p<0.01 and ***p<0.003; refer to the statistically significant differences as indicated.

