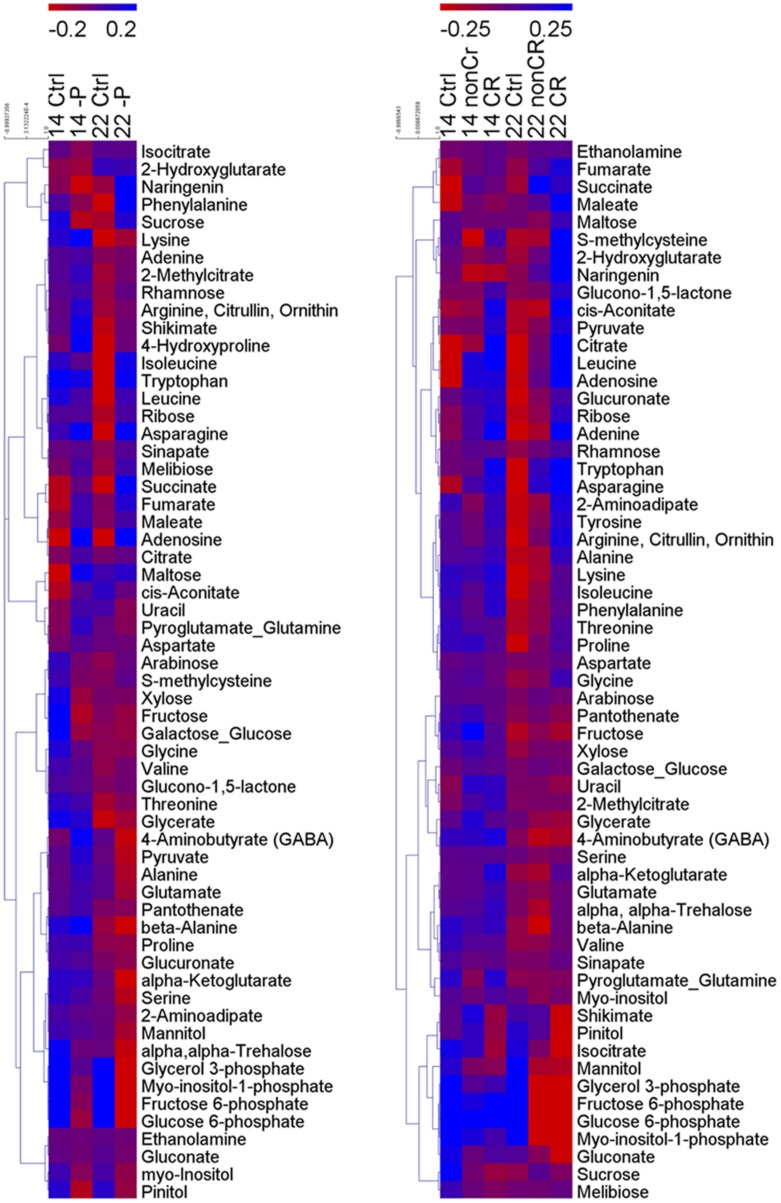
FIGURE 2.
Clustered heatmaps of metabolites of shoots (left) and roots (right). Individual metabolites are represented by rows, and nutritional status and plant age are represented by columns. 14, 14-day old plants; 22, 22 days old plants; Ctrl, control plants; -P, P-deficient shoots; non-CR, non-cluster roots of P-deficient plants; CR, cluster roots of P-deficient plants. Heat map visualization of differences in metabolites is based on log10-transformed metabolite concentrations. Bluish colors indicate increased concentration levels of metabolites, reddish colors decreased metabolite levels. n = 4.

