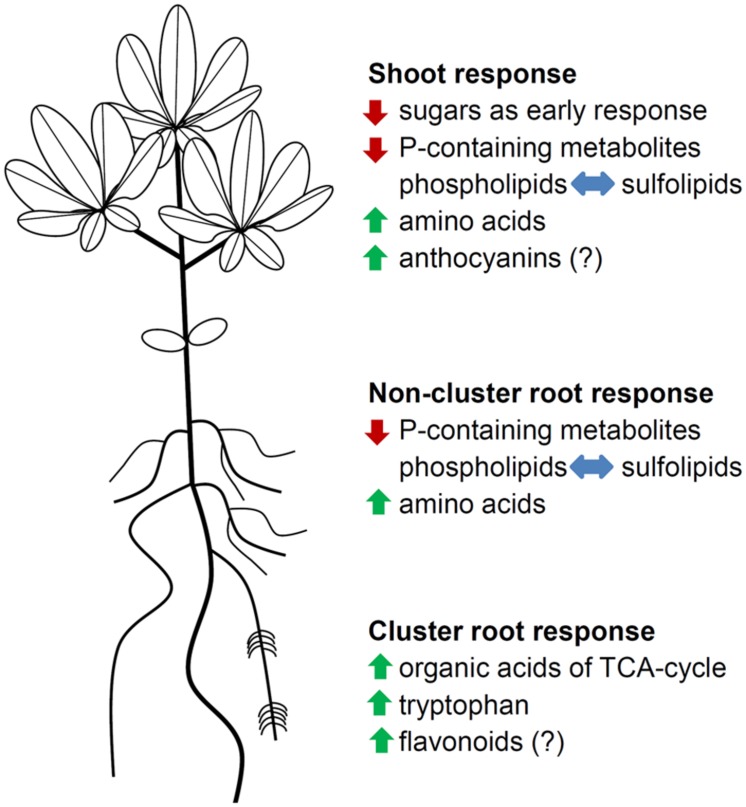
FIGURE 5.
Schematic summary of metabolic and physiological adjustments in P-deficient white lupins. Green arrows indicate an increase in metabolite levels, red arrows indicate a decrease in metabolite levels, and blue arrows indicate a replacement of phospholipids with sulfolipids. Metabolic groups with (?) were not determined.

